|
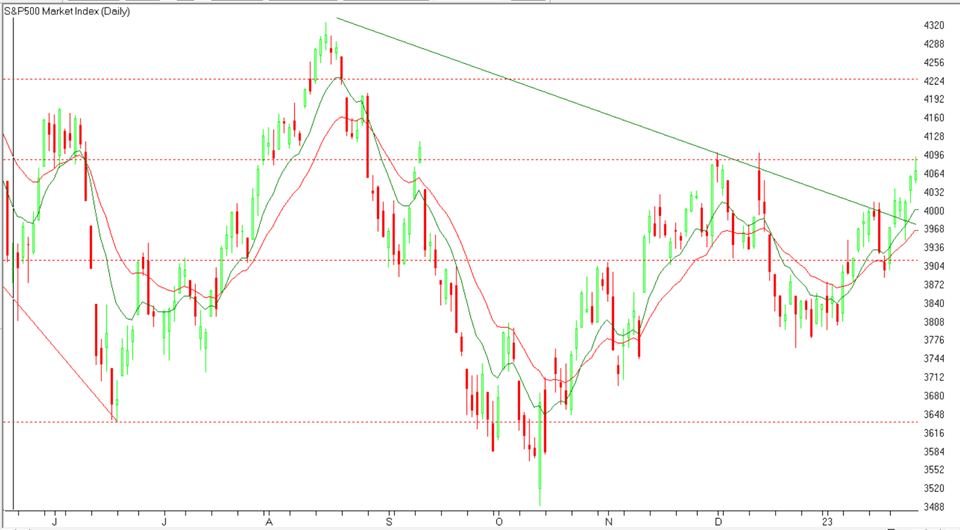
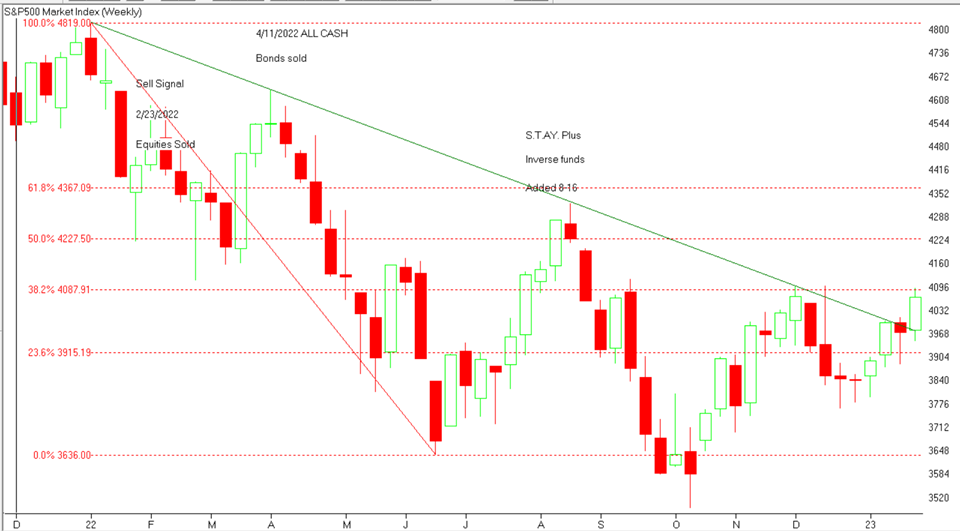
Current position for Active portion of portfolio: SELL – S.T.A.Y. Plus™ Does this mean the end of the bear market? Last week the market did break through a long-term downtrend line to the upside. The question is will this be a successful breakout that leads to a continued uptrend or a failed breakout that leads to the continuation of the long-established downtrend? Only time will tell if it is able to hold above this 12-month long downtrend line. The rules in drawing a trendline is that it has to start with the high point and connect to at least one additional lower high. If it works that a downtrend is supported by more than one lower high it just makes it a more established downtrend line. Take special note of the Market Quiz which deals with an example of a downtrend line that was penetrated through to the upside. We will keep an eye on this situation and keep you posted. Check out the updated charts below and continue scrolling down to review reports from previous weeks. Revisit the "Market Quiz" post to see how our current situation compares to the build up and crash of 2007 & 2008 by clicking HERE.
Comments are closed.
|
208.376.0091Disclaimer: past performance is not a guarantee of future performance. © Copyright - Advanced Financial Solutions, Inc.
|