|
Current position for Active portion of portfolio: SELL – S.T.A.Y. Plus™ Downtrend Breakout Has Relented Last week the market dropped about 5%, bringing it back in line with the 12-month downtrend (see weekly chart below). The rules in drawing a trendline are that it must start with the high point and connect to at least one additional lower high. If a downtrend is supported by more than one lower high it becomes a more established downtrend. We are very curious to see if this downtrend will continue in a relatively steady fashion or if we will see a dramatic plunge as we did in 2000 and in 2007. We will keep an eye on this situation and keep you posted. For now, we will remain invested inverse to the market so that we can make gains as the market trends down. If/when the market shows meaningful and mathematically measurable signs of breaking out of the long-term down trend, we will adjust accordingly. Until then, we are well positioned to make gains in this environment. ********************************** By way of review and to better understand the weekly candlestick charts, it may be helpful to notice that each week is represented by a single "candlestick". The red candlesticks denote weeks that ended trading lower than they started. The top of a red candlestick is where the week opened. The bottom is where it closed. As you might guess, the green candlesticks represent weeks where the market closed higher than where it opened. The bottom of the green candlestick is where the market opened, and the top is where it closed. The "wicks" on the candlesticks represent intra-week highs & lows. 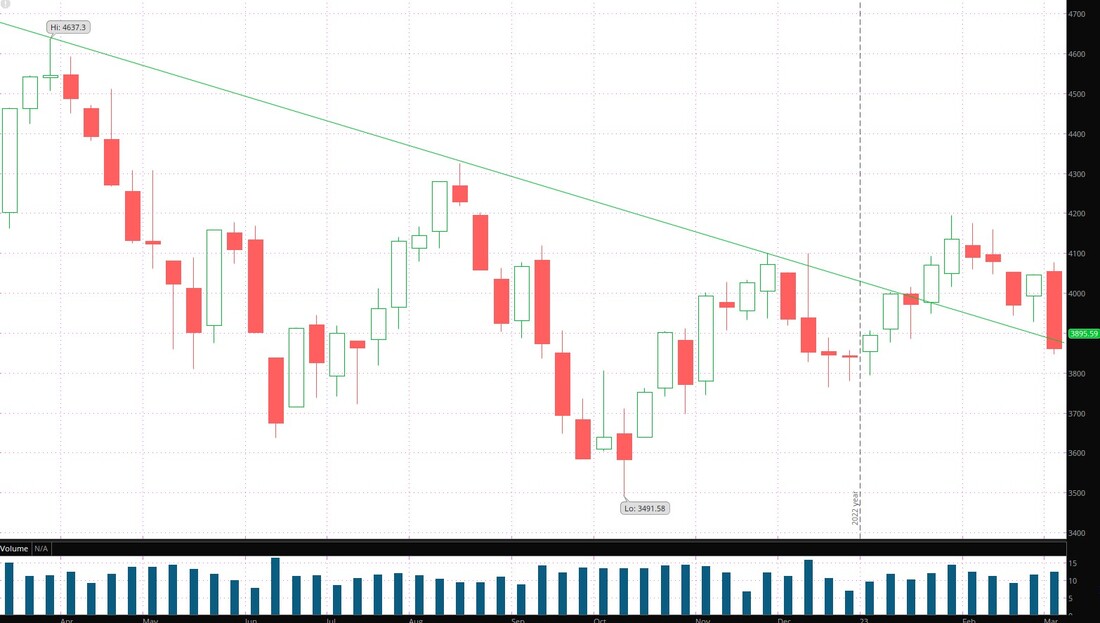
Comments are closed.
|
208.376.0091Disclaimer: past performance is not a guarantee of future performance. © Copyright - Advanced Financial Solutions, Inc.
|