|
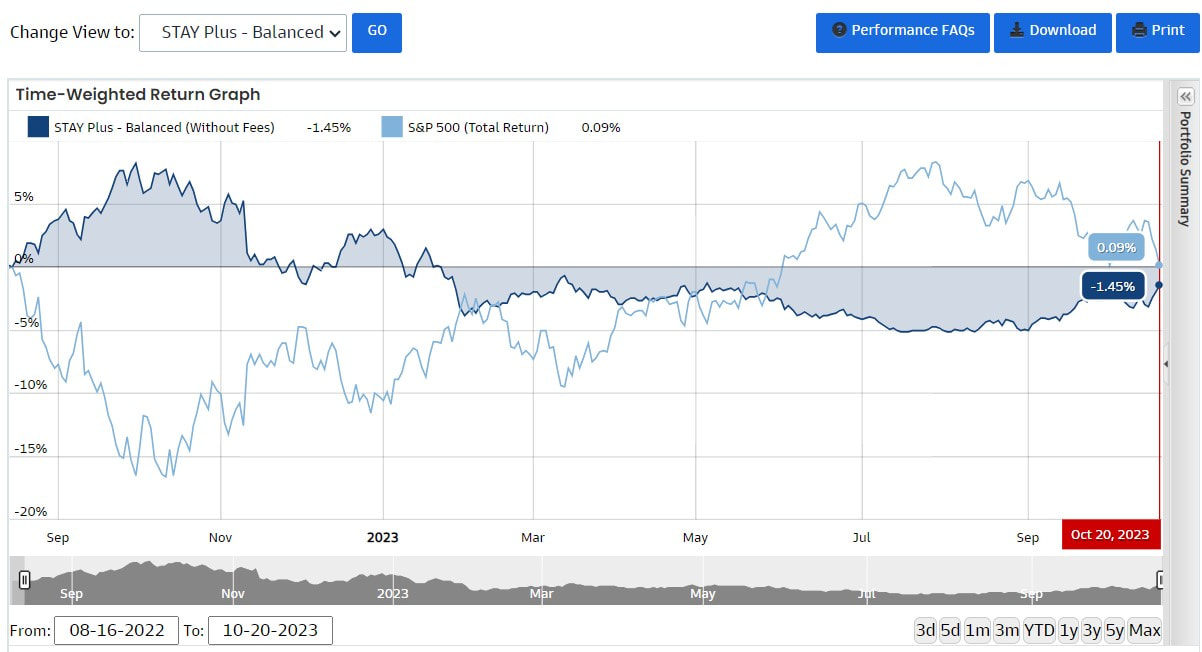
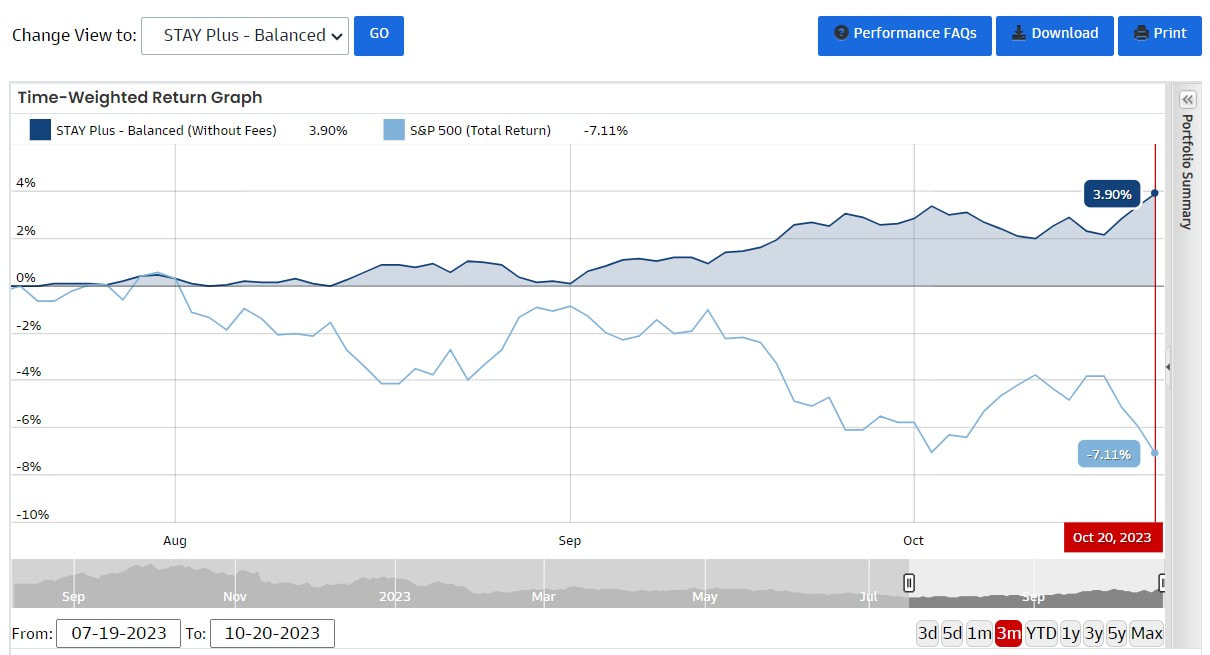
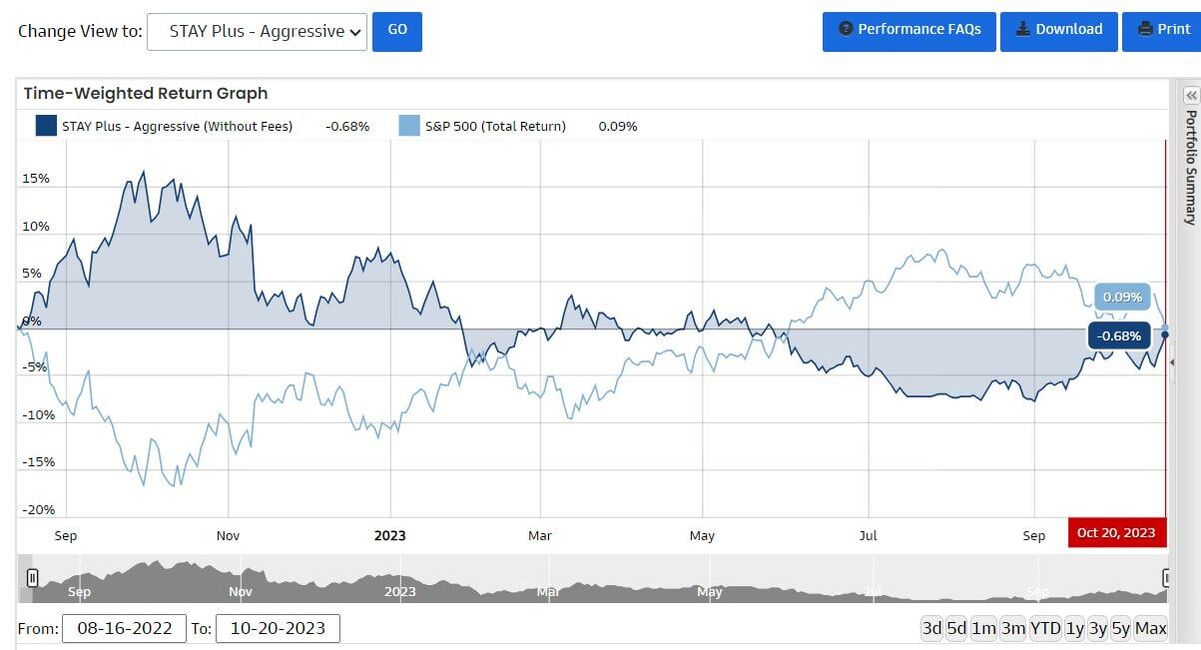
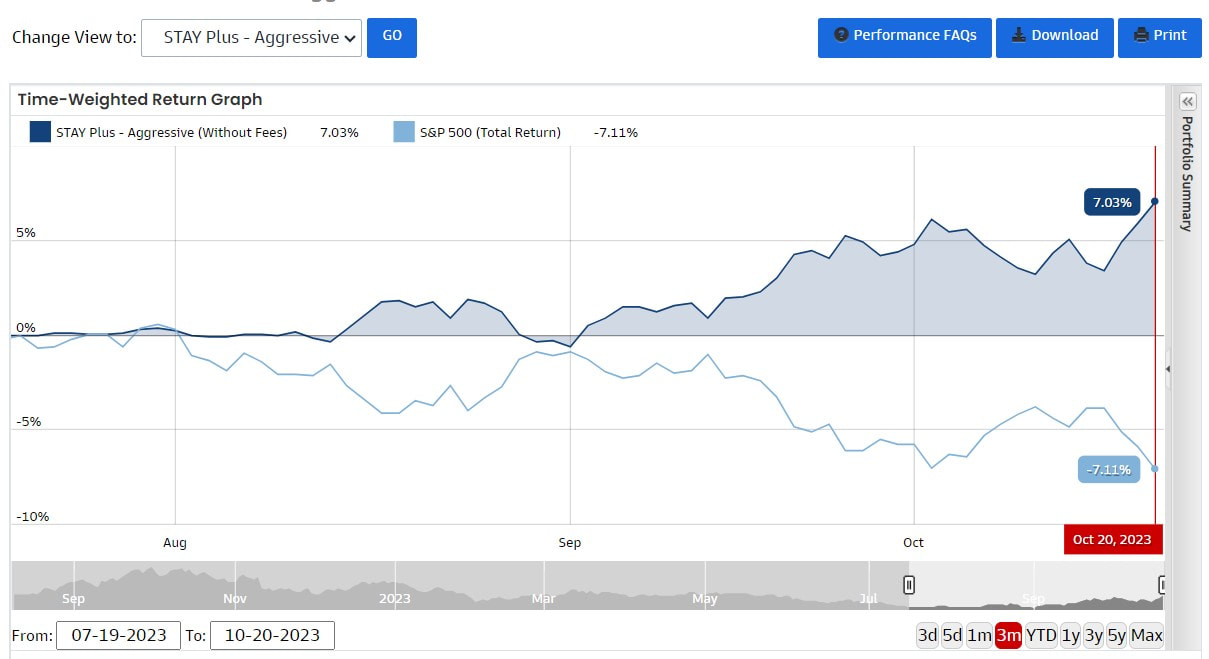
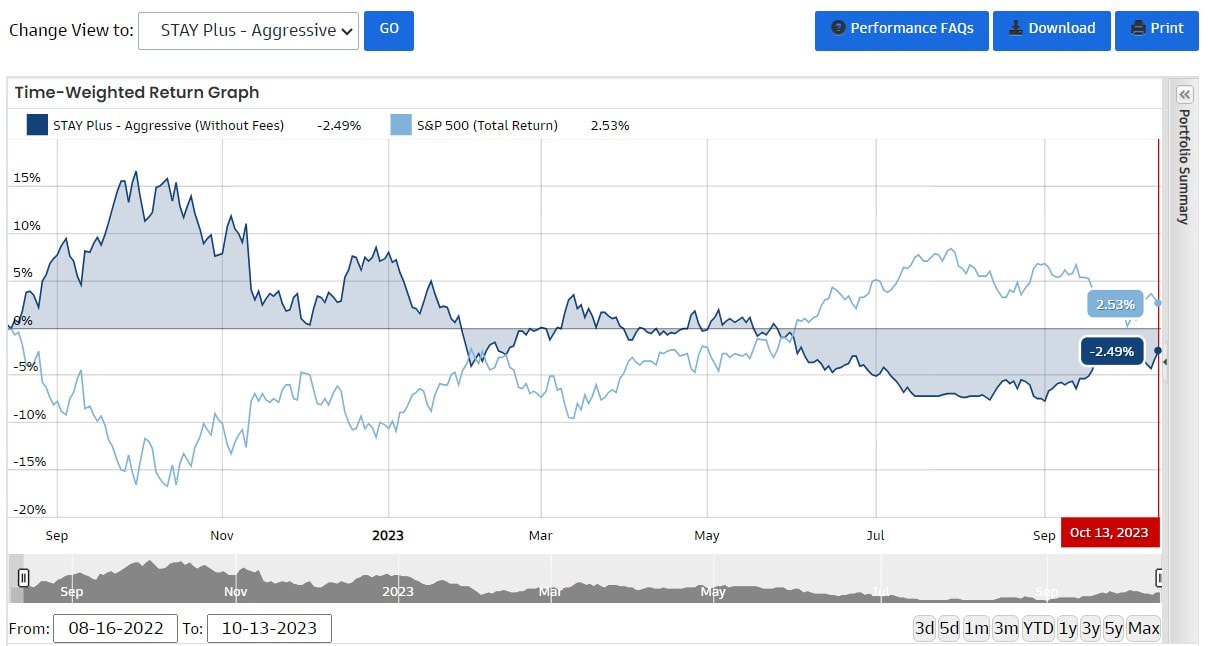
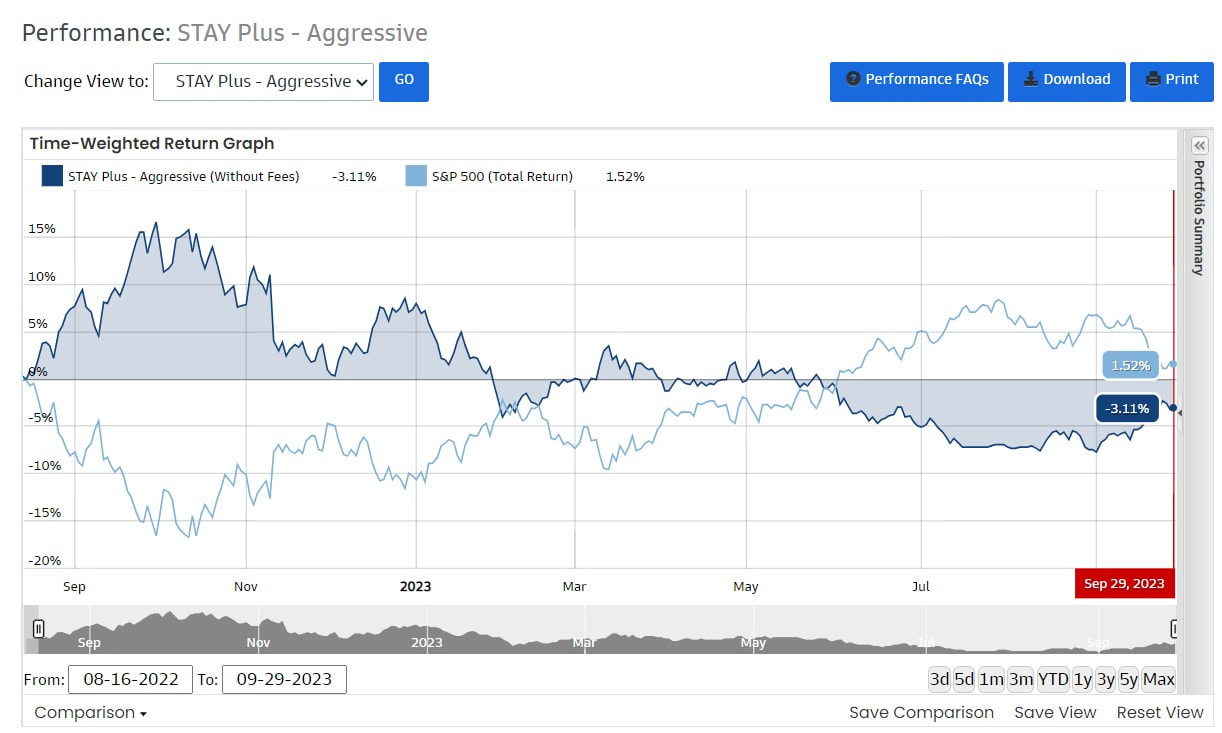
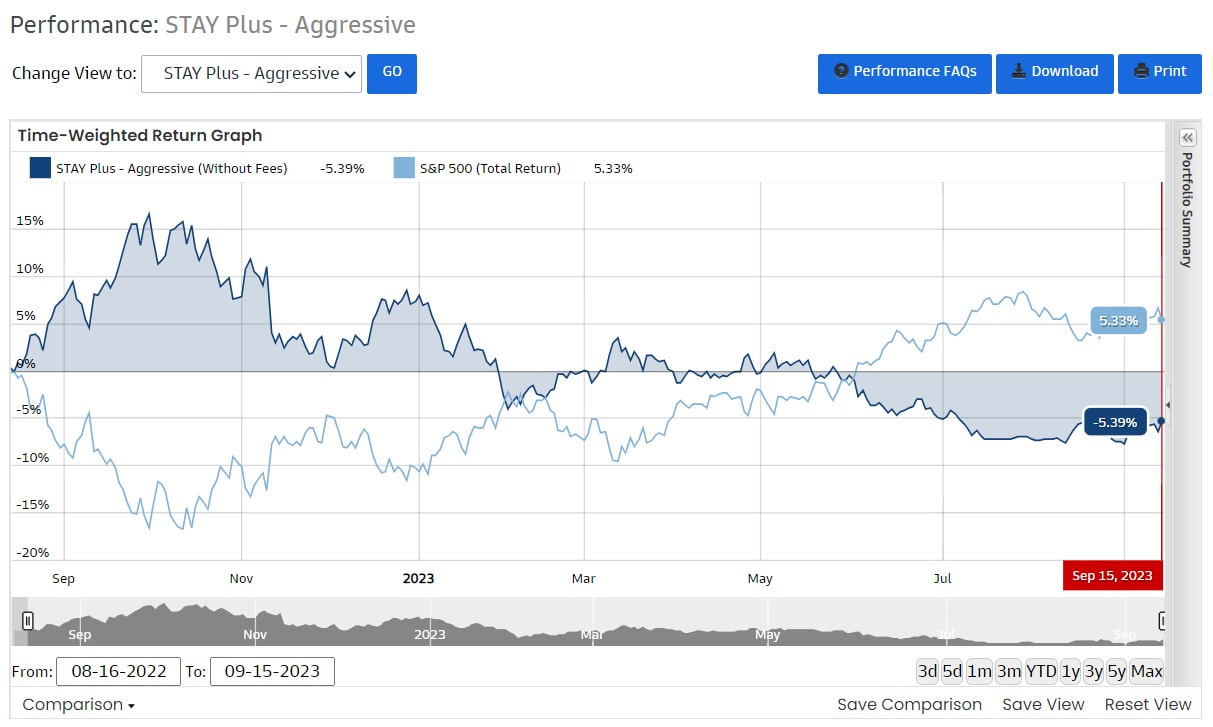
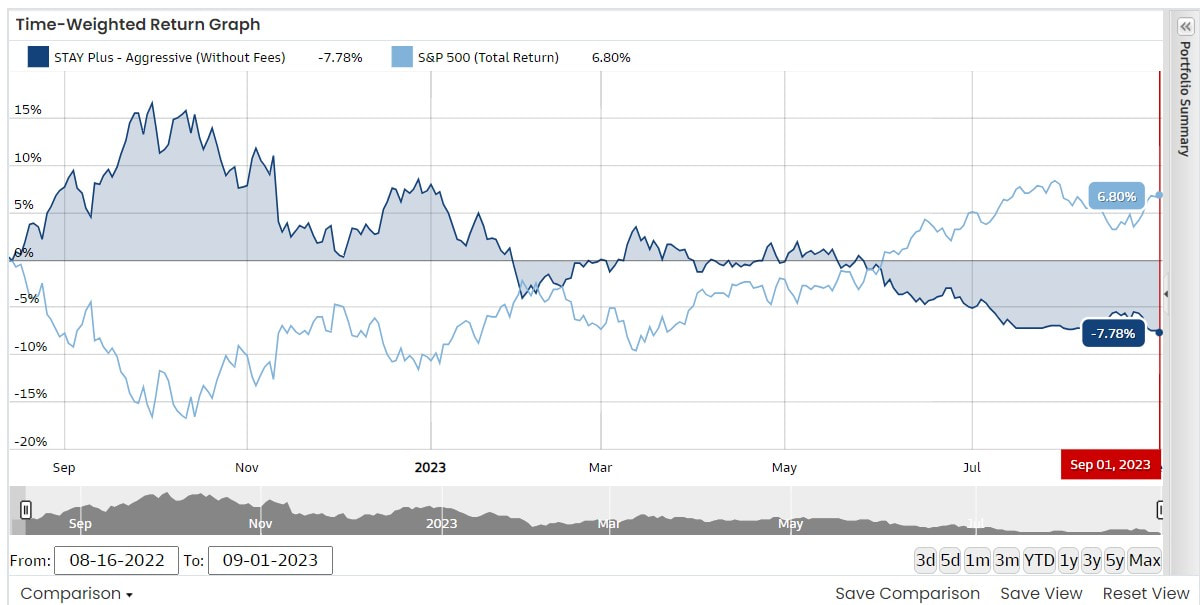
S.T.A.Y.™ current position for Active portion of portfolio: CASH – S.T.A.Y. Plus™ Lower Lows and Lower Highs. Market continues in a definite downtrend since high of 7/27/2023. Last week the S&P 500 ended with a large loss of about 2½% for the week. Since July, there have been eight down weeks out of twelve following the high of 7/27/2023, which has created new lows in the S&P 500. As was mentioned in previous weeks, we are in a “mountain road” market, therefore we took an inverse position on 8/11/2023. The positive results of taking an inverse position are shown in the "3 month" charts below. We will stay in an inverse position until our shorter-term indicators show otherwise. This position may be for a few days or a few weeks as we will be operating off of our shorter-term indicators to make changes as needed in a timelier fashion. We will keep you posted. Weekly S&P 500 Chart with Fibonacci Retracement Percentages (from the all-time high) 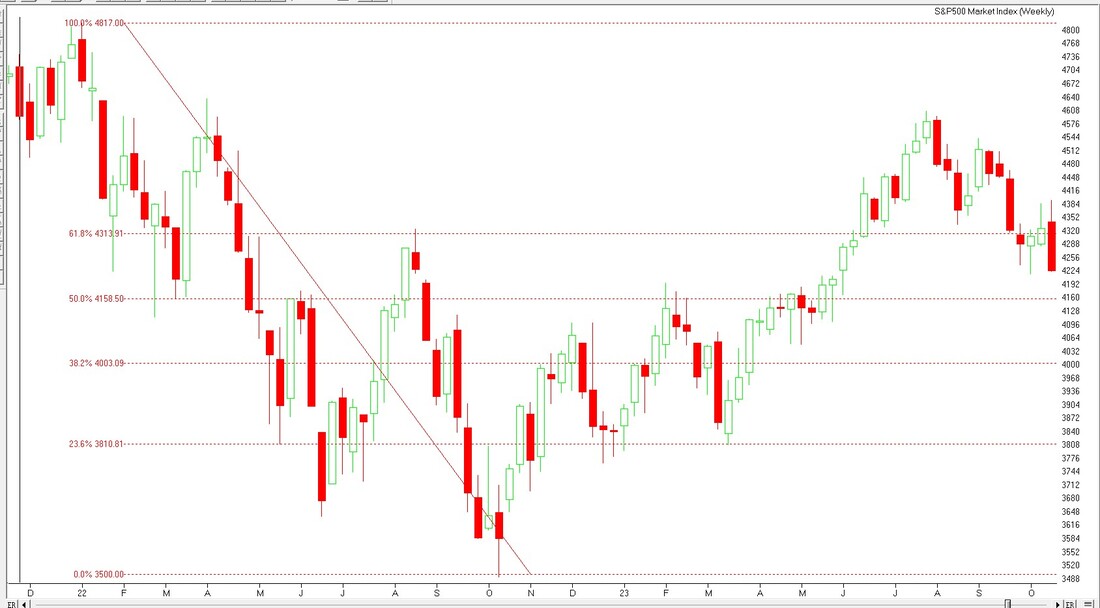 Monthly S&P 500 Chart with Fibonacci Retracement Percentages (from the all-time high) 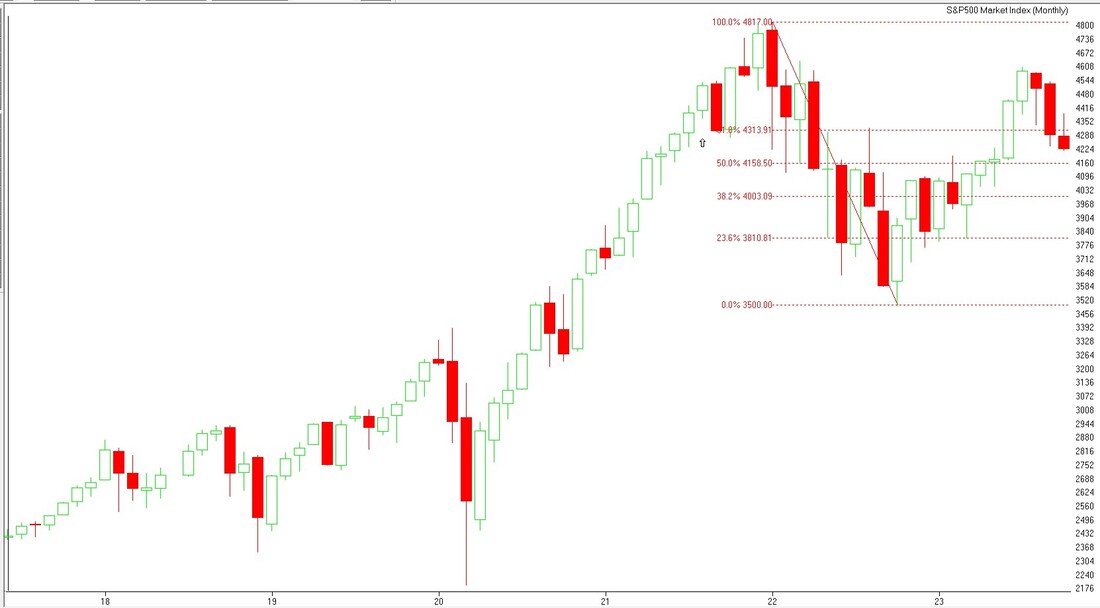
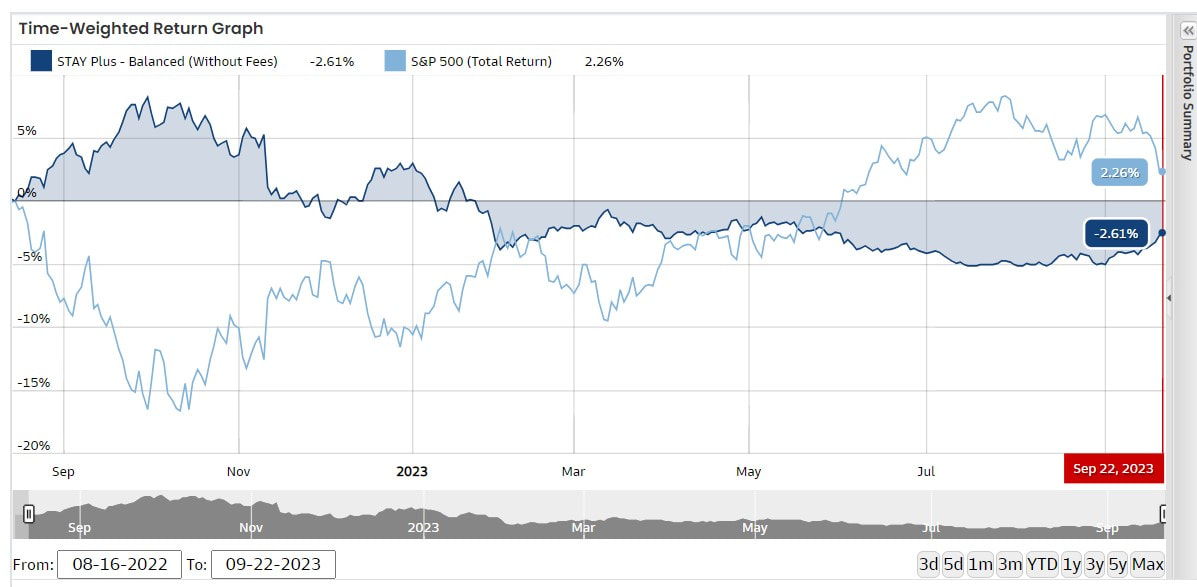
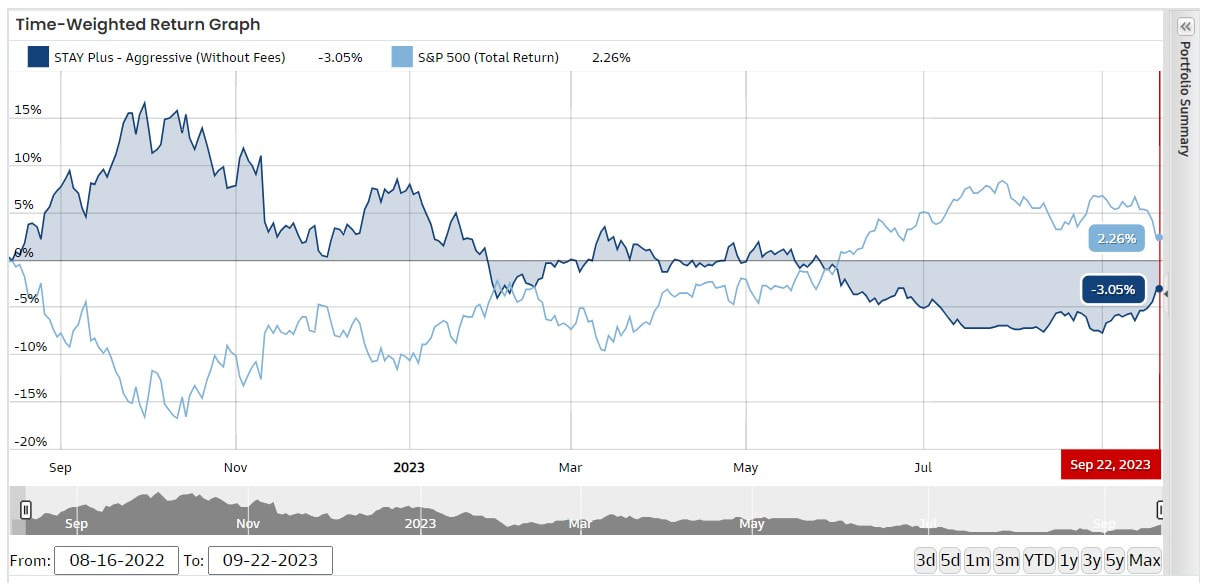
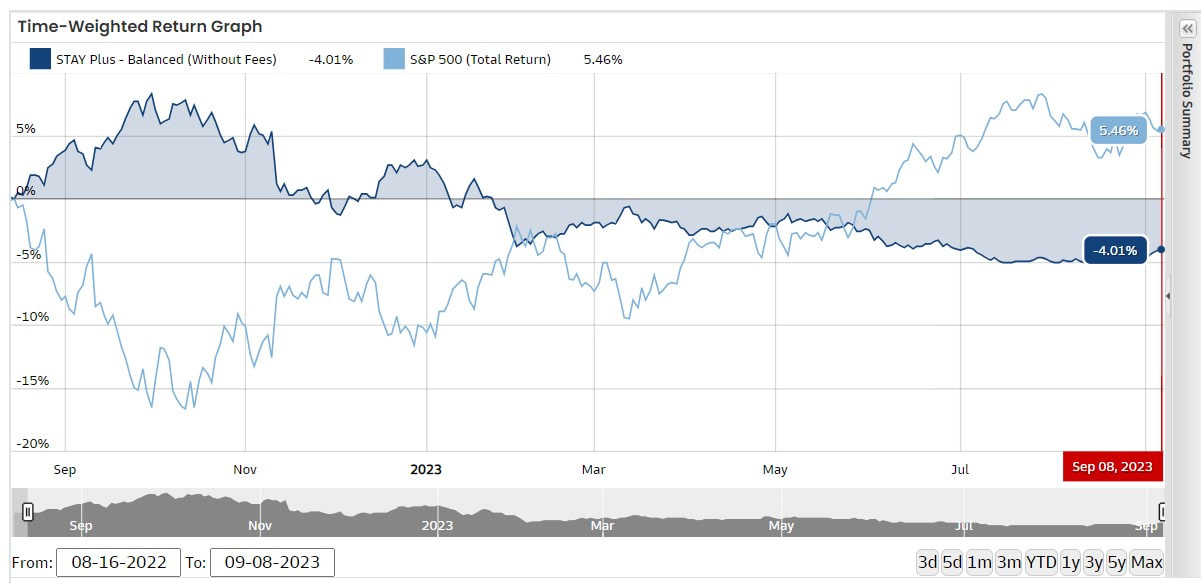
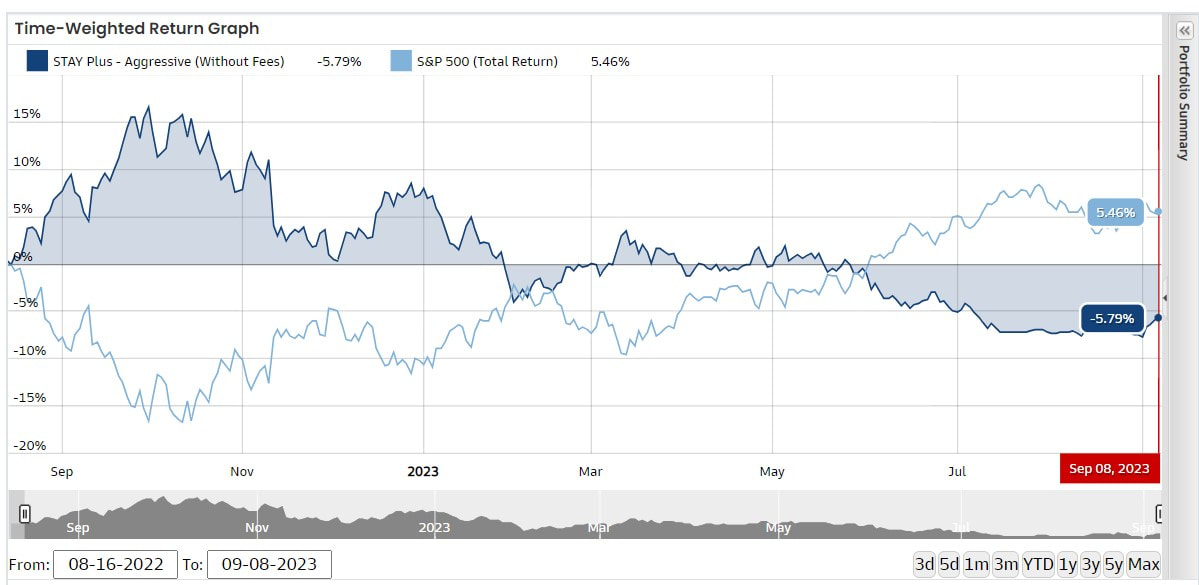
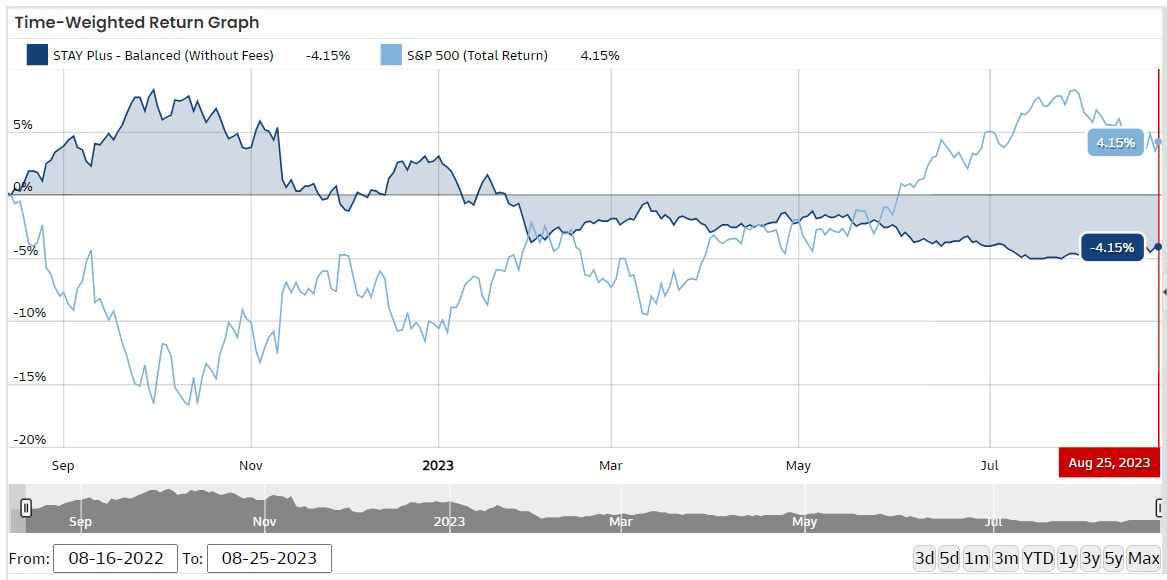
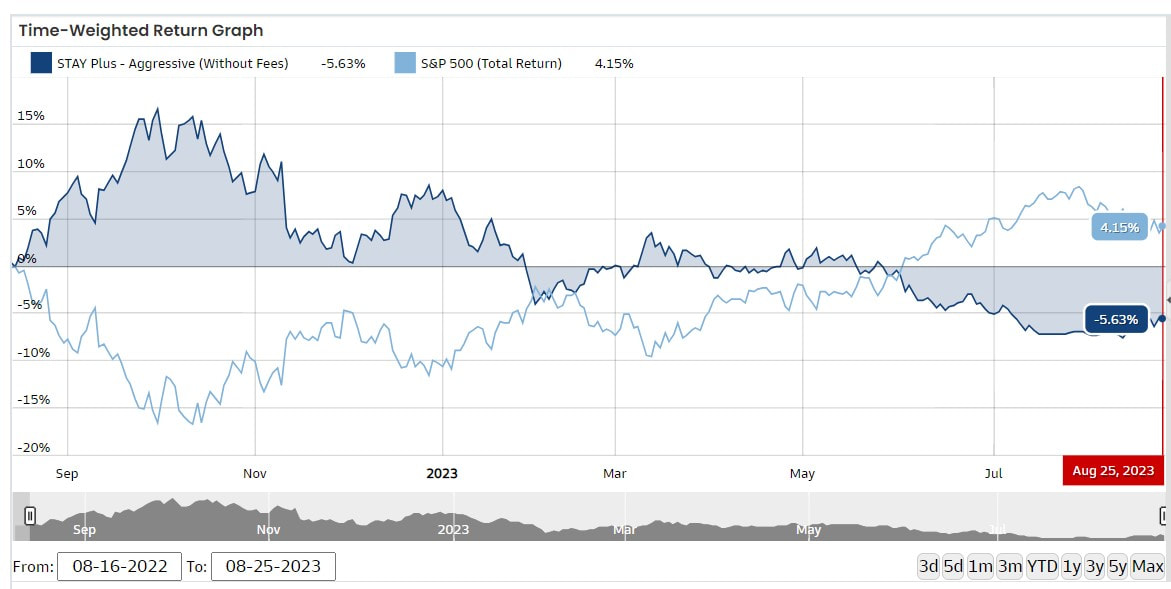
S.T.A.Y.™ current position for Active portion of portfolio: CASH – S.T.A.Y. Plus™ Market continues in a definite downtrend since high of 7/27/2023. Last week ended with a slight positive retracement of some of the previous downtrend. However, there still have been seven down weeks out of eleven following the high of 7/27/2023 which have created new lows and wiped out of all last summer’s gains. As was mentioned in previous weeks, we are in a “mountain road” market, therefore we have taken an inverse position on 8/11/2023. We will stay in that position until our shorter-term indicators show otherwise. This position may be for a few days or a few weeks as we will be operating off of our shorter-term indicators to make changes as needed in a timelier fashion. We will keep you posted. Weekly Chart with Fibonacci Retracement Percentages (from the all-time high)  Monthly Chart with Fibonacci Retracement Percentages (from the all-time high) 
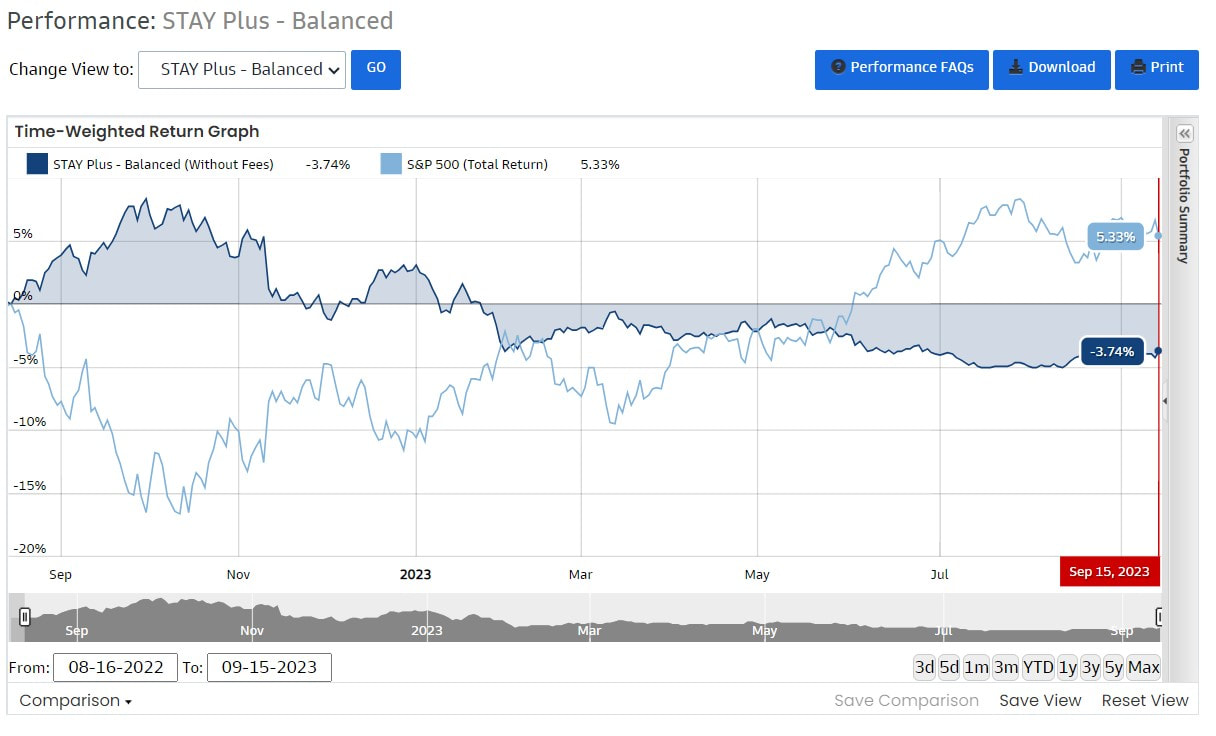
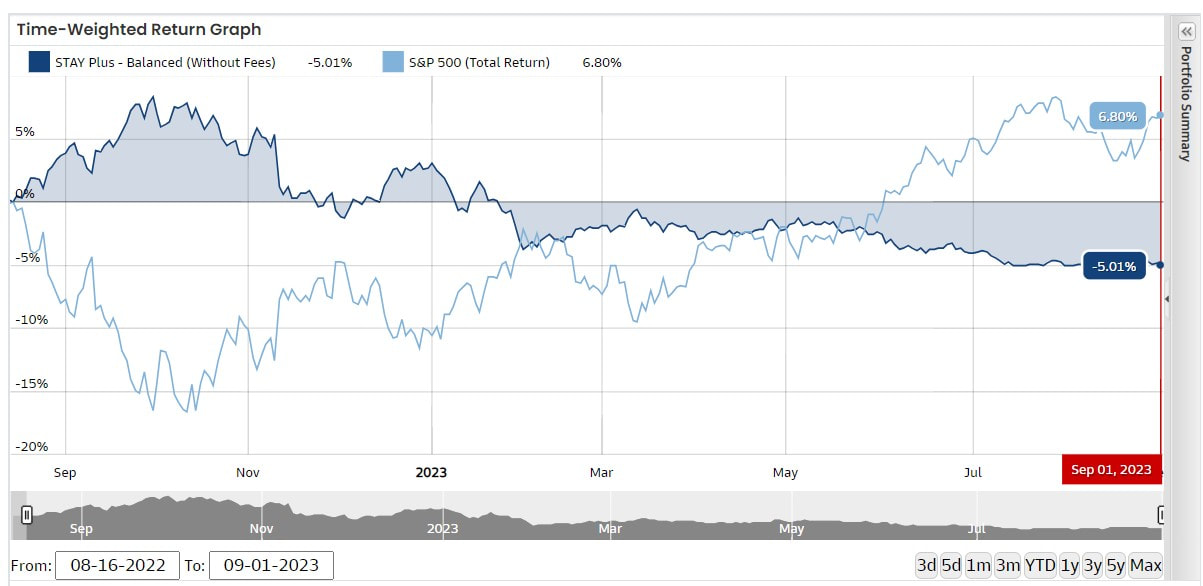
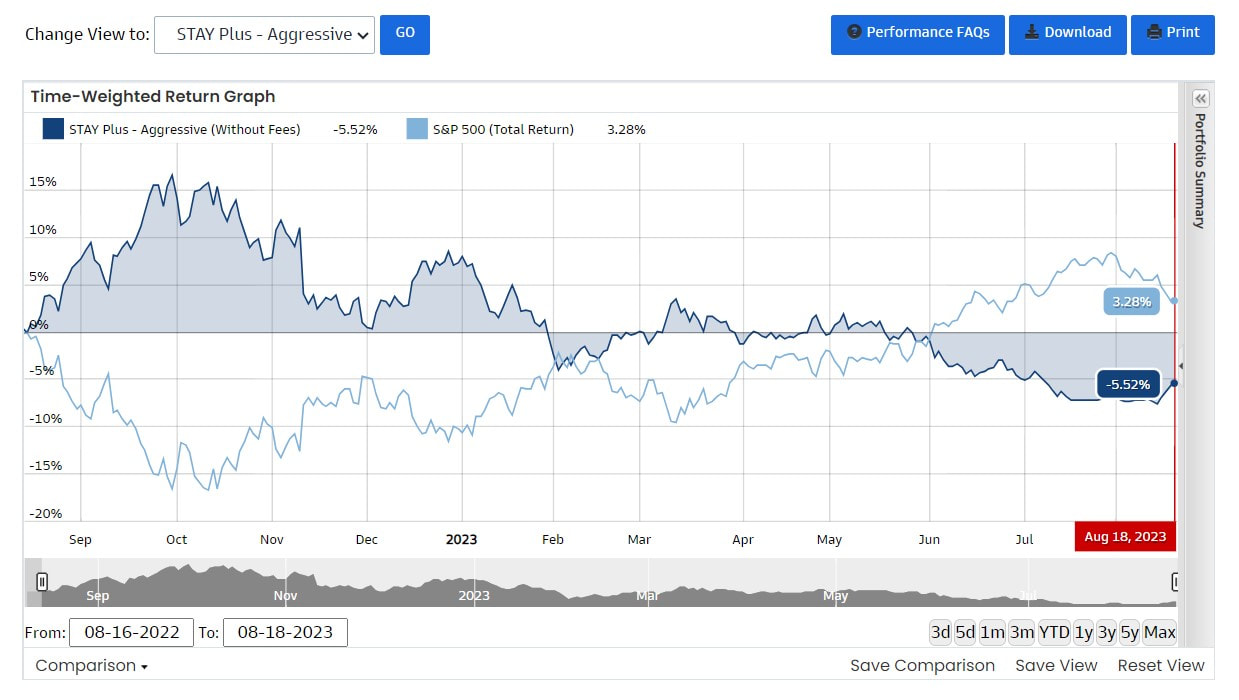
S.T.A.Y.™ current position for Active portion of portfolio: CASH – S.T.A.Y. Plus™ Market continues in a definite downtrend since high of 7/27/2023. Last week made a lower low from the 27th high and then ended the week positive retracing some of the previous downtrend (see the candle stick to the far right of the weekly chart below). However, there still have been seven down weeks out of ten following the high of 7/27/2023 which have created new lows and wiped out of all last summer’s gains. As was mentioned in previous weeks, we are in a “mountain road” market, therefore we have taken an inverse position on 8/11/2023. We will stay in that position until our shorter-term indicators show otherwise. This position may be for a few days or a few weeks as we will be operating off of our shorter-term indicators to make changes as needed in a timelier fashion. We will keep you posted. Weekly Chart with Fibonacci Retracement Percentages (from the all-time high) 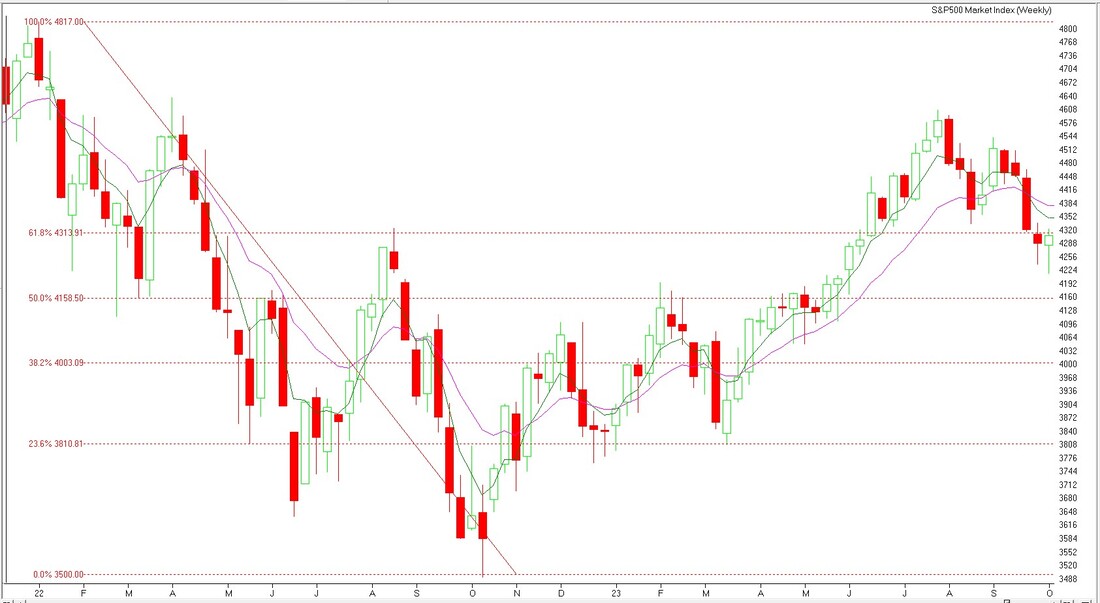 Monthly Chart with Fibonacci Retracement Percentages (from the all-time high) 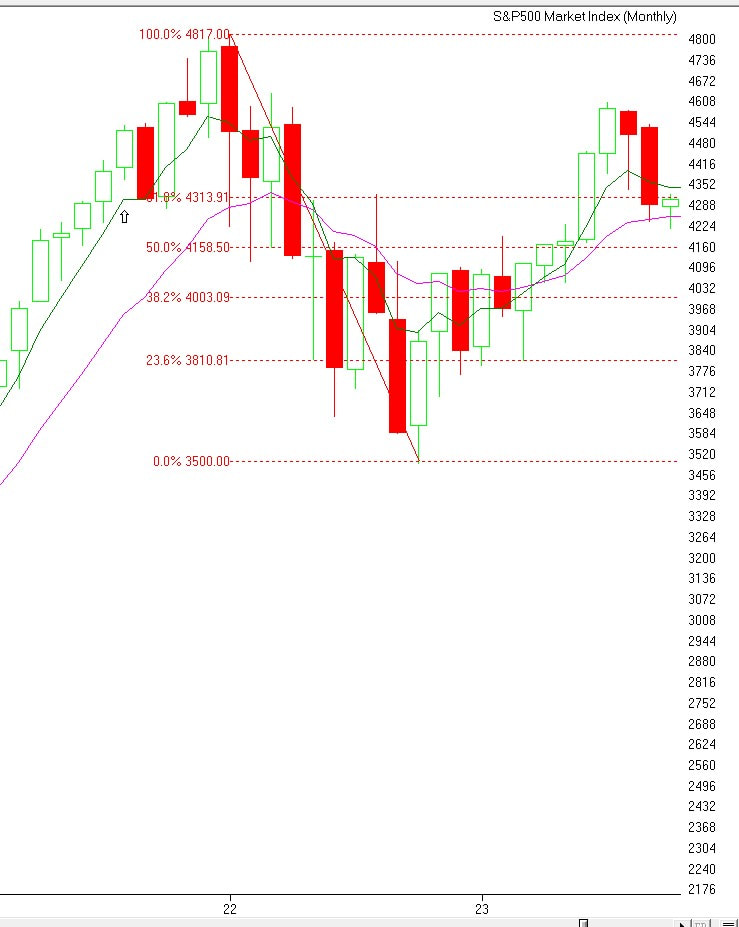
S.T.A.Y.™ current position for Active portion of portfolio: CASH – S.T.A.Y. Plus™ Market continues in a definite downtrend since high of 7/27/2023. Seven out of the last nine weeks have been down weeks. This is best visualized on the weekly chart below. Each candlestick represents a week. The red ones are the down weeks. The top of the red stick is where the week opened. The bottom is the weeks close. The "wicks" represent the inter-week trading range. Since the high of 7/27/2023, almost all of the summer’s gains have been wiped out. As was mentioned in previous weeks, we are in a “mountain road” market, therefore we have taken an inverse position on 8/11/2023. We will stay in that position until our shorter-term indicators show otherwise. This position may be for a few more days or a few more weeks as we will be operating off of our shorter-term indicators to make changes as needed in a timelier fashion. We will keep you posted. Weekly Chart with Fibonacci Retracement Percentages (from the all-time high) 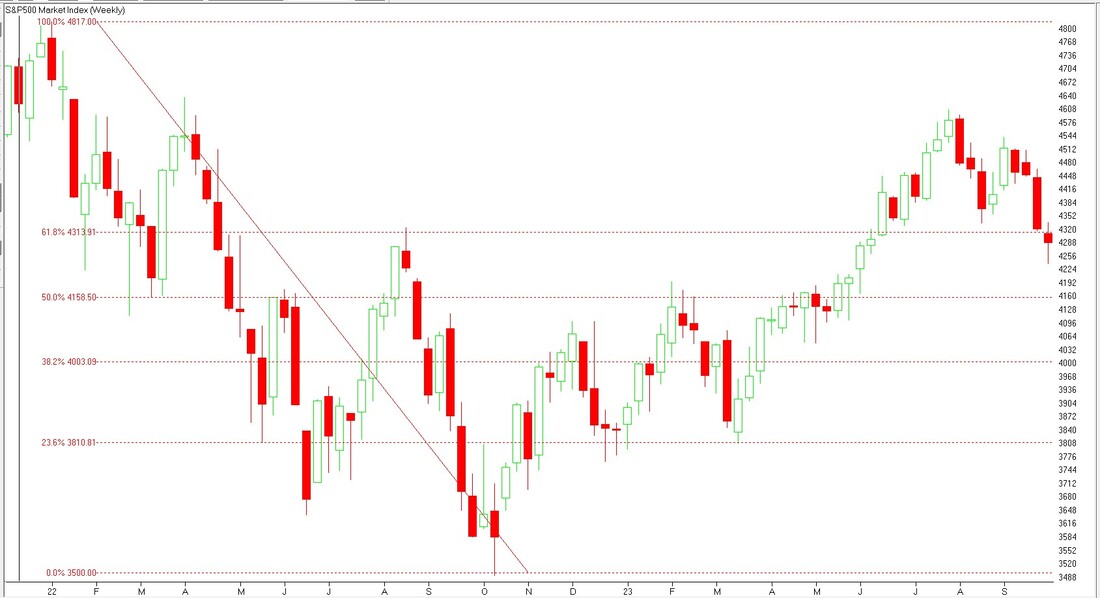 Monthly Chart with Fibonacci Retracement Percentages (from the all-time high) 
S.T.A.Y.™ current position for Active portion of portfolio: CASH – S.T.A.Y. Plus™ Market continues in a definite downtrend since high of 7/27/2023. Since 7/27/2023 there have been three down weeks followed by two up weeks followed again by three more down weeks which created a new low and wiped out all last summer’s gains. As was mentioned in previous weeks, we are in a “mountain road” market, therefore we have taken an inverse position on 8/11/2023. We will stay in that position until our shorter-term indicators show otherwise. This position may be for a few days or a few weeks as we will be operating off of our shorter-term indicators to make changes as needed in a timelier fashion. We will keep you posted. Weekly Chart with Fibonacci Retracement Percentages (from the all-time high) 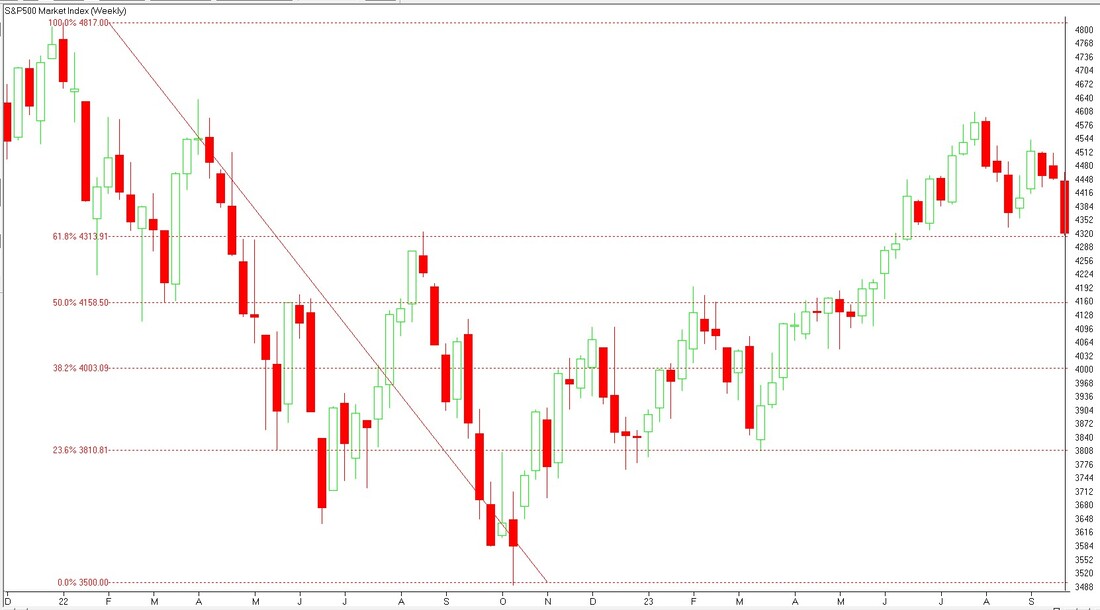 Monthly Chart with Fibonacci Retracement Percentages (from the all-time high) 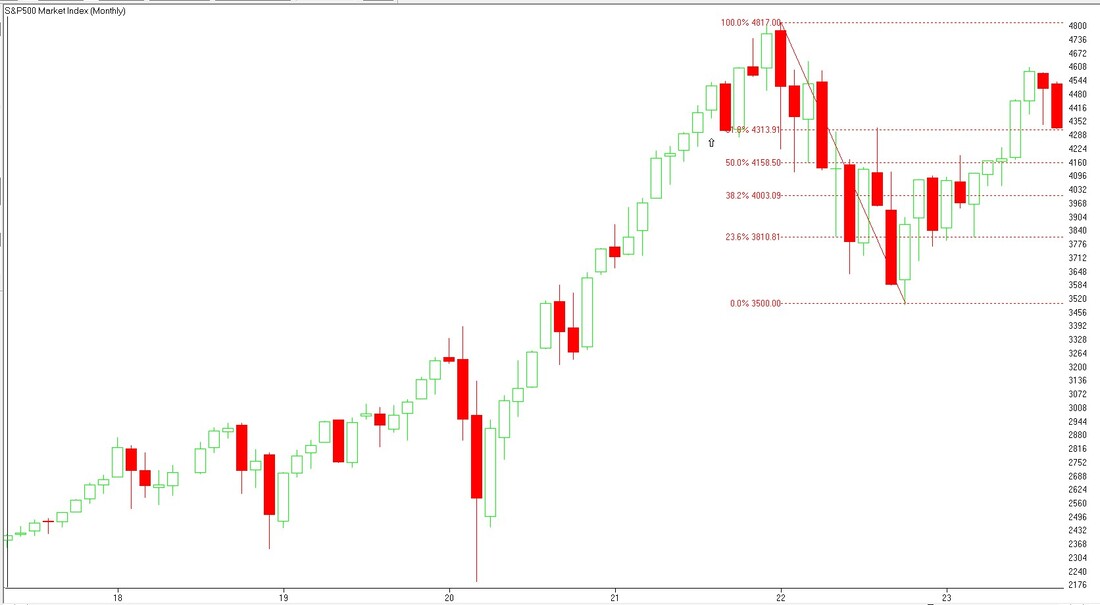
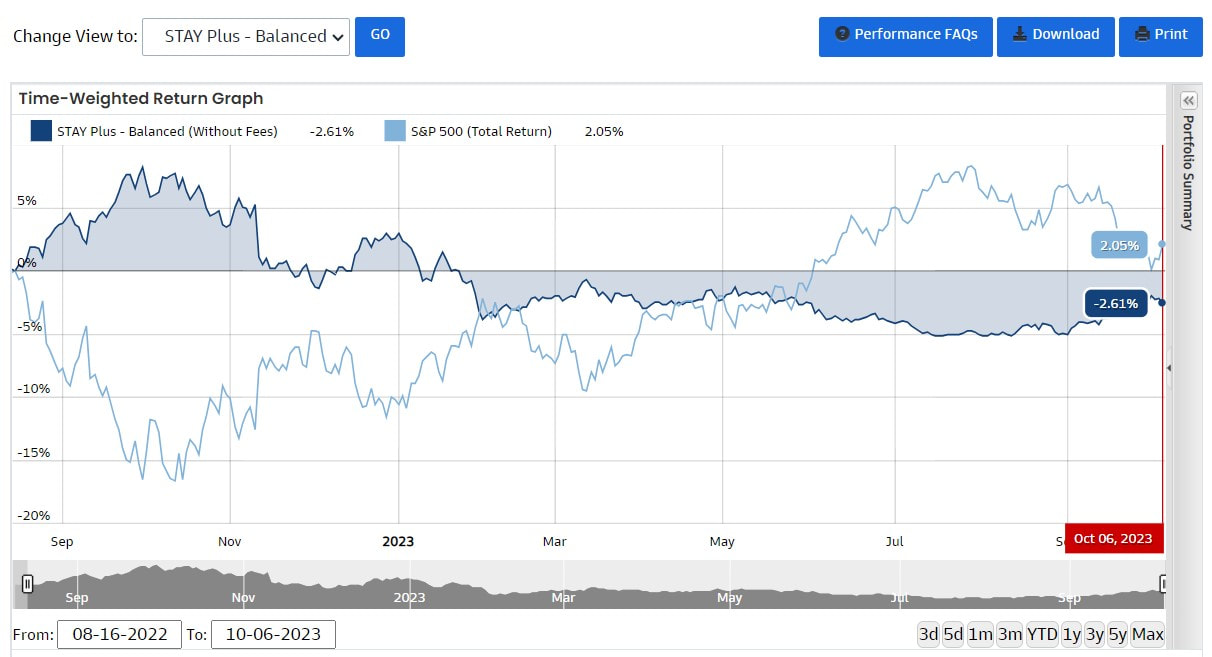
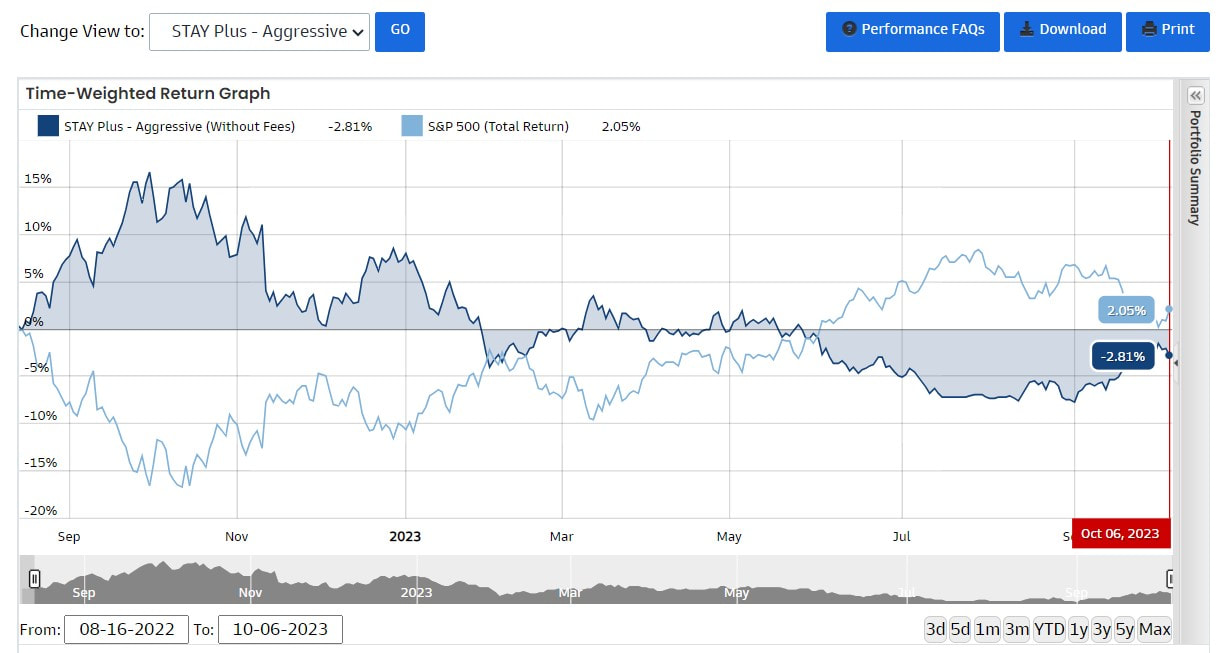
S.T.A.Y.™ current position for Active portion of portfolio: CASH – S.T.A.Y. Plus™ The market has been in a definite downtrend since the high of 7/27/2023 and continued last week. The definition of a downtrend is lower lows and lower highs. This downtrend is most visible on the weekly and monthly charts below. As was mentioned in previous weeks, we are in a “mountain road” market, and are still in an inverse positions in all of the STAY portfolios since 8/11/2023. We will stay in that position until our short-term indicators show otherwise. This position may be for a few days or a few weeks as we will be operating off of our short-term indicators to make changes as needed in a timely fashion. We will keep you posted. Weekly Chart with Fibonacci Retracement Percentages (from the all-time high) 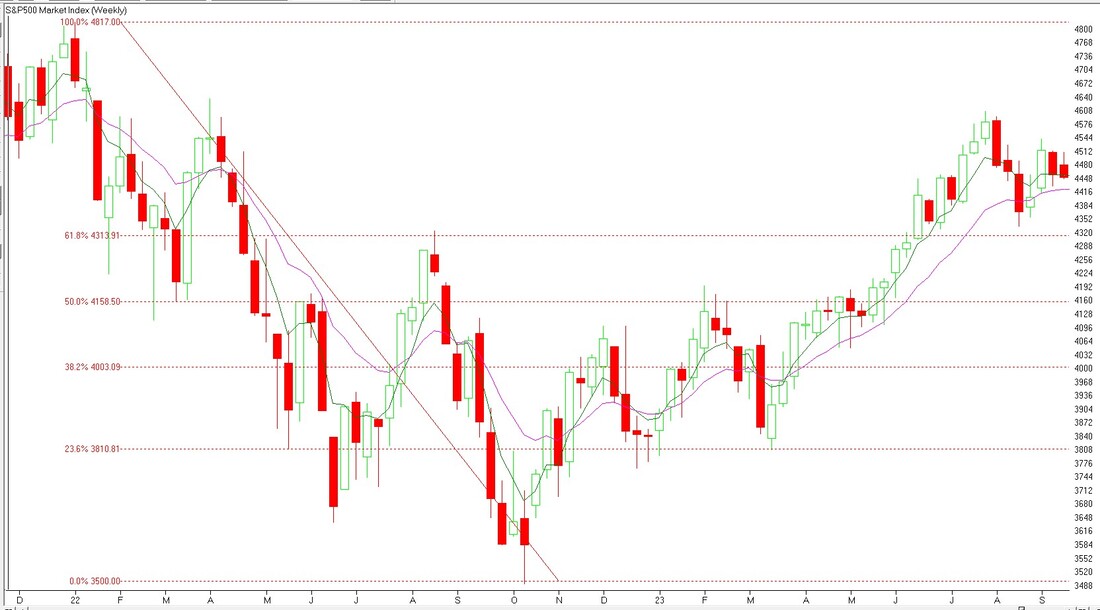 Monthly Chart with Fibonacci Retracement Percentages (from the all-time high) 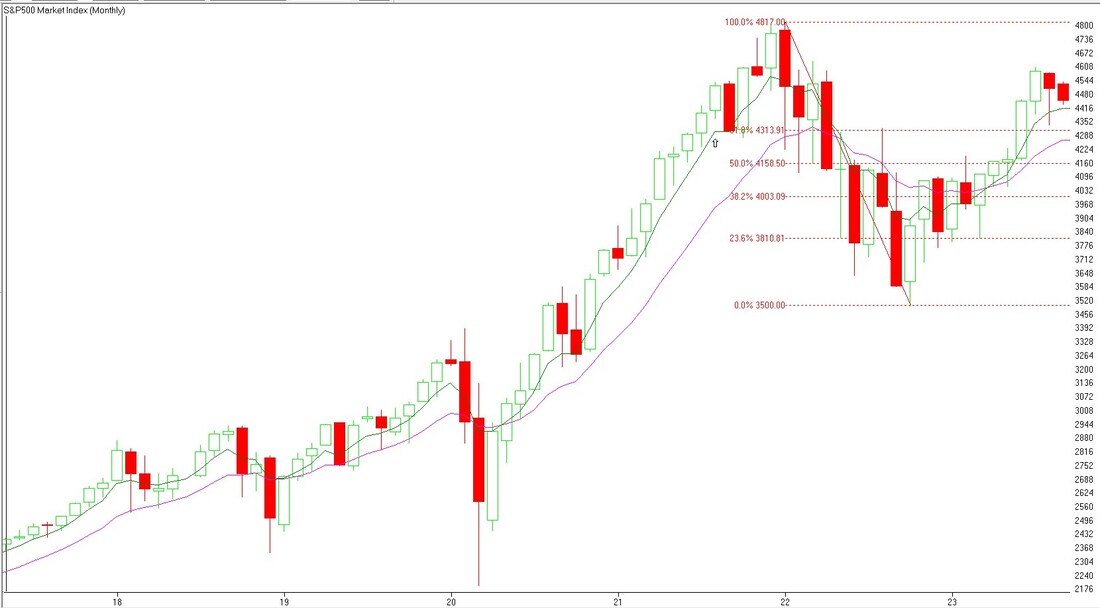
S.T.A.Y.™ current position for Active portion of portfolio: CASH – S.T.A.Y. Plus™ The market has been in a definite downtrend since the high of 7/27/2023. The definition of a downtrend is lower lows and lower highs. This downtrend is most visible on the weekly chart below. As was mentioned in previous weeks, we are in a “mountain road” market, and are still in an inverse positions in all of the STAY portfolios since 8/11/2023. We will stay in that position until our short-term indicators show otherwise. This position may be for a few days or a few weeks as we will be operating off of our short-term indicators to make changes as needed in a timely fashion. We will keep you posted. Weekly Chart with Fibonacci Retracement Percentages (from the all-time high) 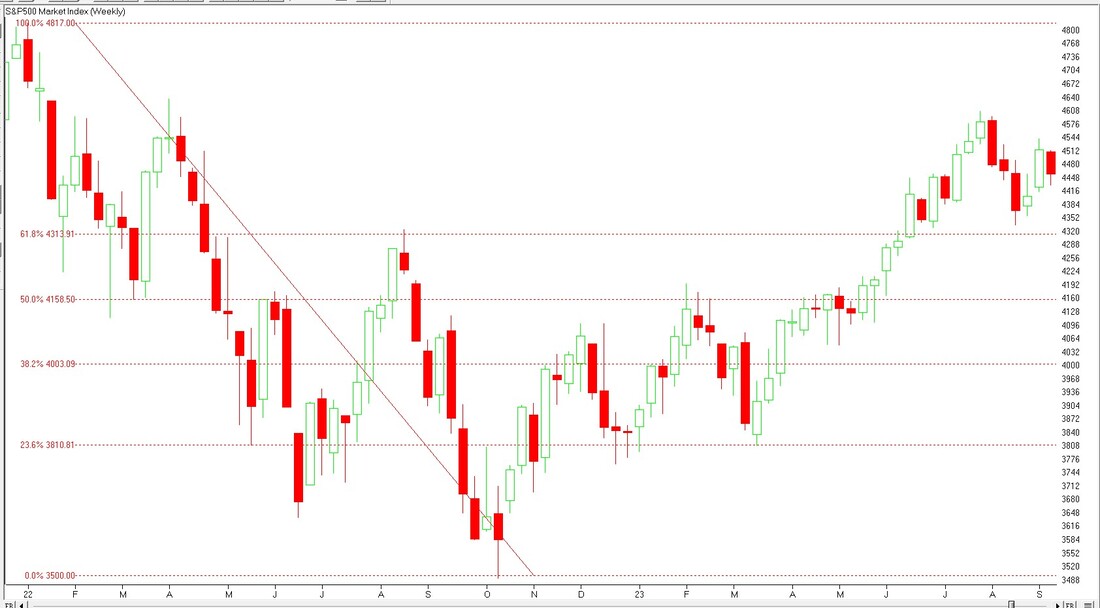 Monthly Chart with Fibonacci Retracement Percentages (from the all-time high) 
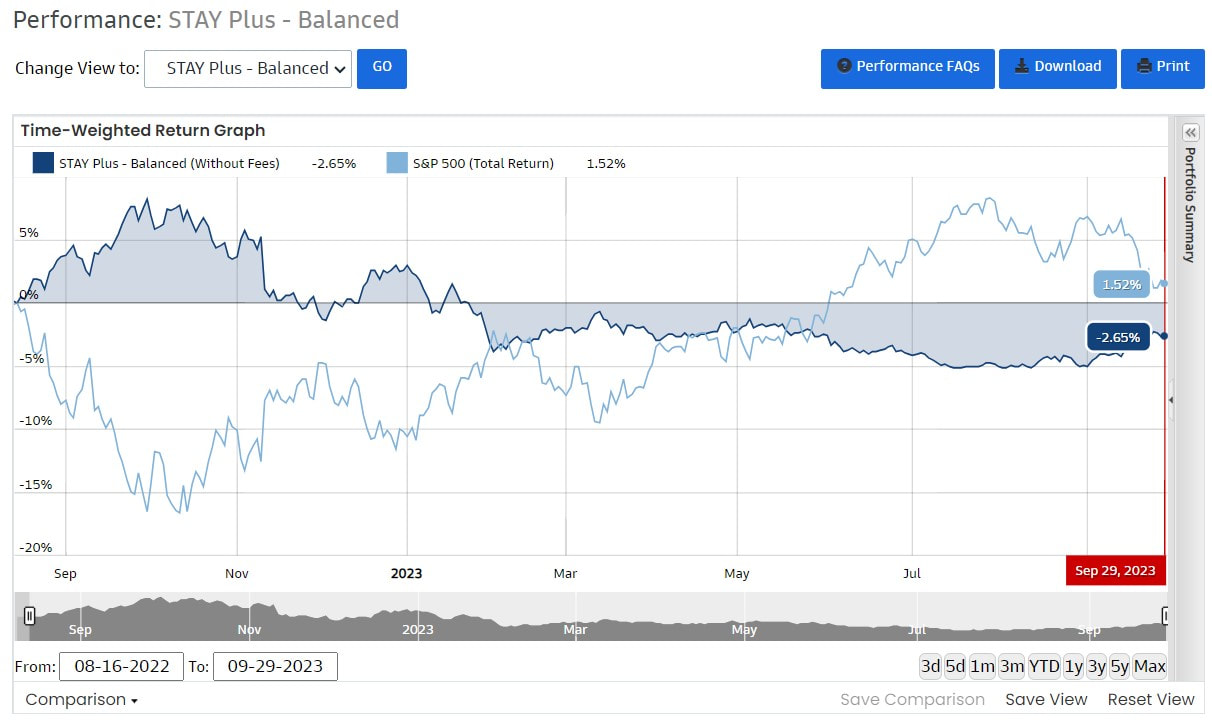
S.T.A.Y.™ current position for Active portion of portfolio: CASH – S.T.A.Y. Plus™ The market has been in a definite downtrend since the high of 7/27/2023. This is most visible on the weekly chart below. While the market had three consecutive down weeks since 7/27/2023, the last two weeks have been up and retraced approximately two-thirds of the down. The last three trading days have produce no significant changes up or down. As was mentioned in previous weeks, we are in a “mountain road” market, and are still in an inverse positions in all of the STAY portfolios since 8/11/2023. We will stay in that position until our short-term indicators show otherwise. This position may be for a few days or a few weeks as we will be operating off of our short-term indicators to make changes as needed in a timely fashion. We will keep you posted. Weekly Chart with Fibonacci Retracement Percentages (from the all-time high)  Monthly Chart with Fibonacci Retracement Percentages (from the all-time high) 
S.T.A.Y.™ current position for Active portion of portfolio: CASH – S.T.A.Y. Plus™ The market has been in a definite downtrend since the high of 7/27/2023. This is most visible on the weekly chart below. While the market had three consecutive down weeks since 7/27/2023, last week was slightly up, but not enough to make a meaningful difference in the downtrend. As was mentioned in previous weeks, we are in a “mountain road” market, and have taken an inverse positions in all of the STAY portfolios since 8/11/2023. We will stay in that position until our short-term indicators show otherwise. This position may be for a few days or a few weeks as we will be operating off of our short-term indicators to make changes as needed in a timely fashion. We will keep you posted. Weekly Chart with Fibonacci Retracement Percentages (from the all-time high)  Monthly Chart with Fibonacci Retracement Percentages (from the all-time high) 
S.T.A.Y.™ current position for Active portion of portfolio: CASH – S.T.A.Y. Plus™ The market has been in a definite downtrend since the high of 7/27/2023. The market has had three consecutive down weeks since 7/27/2023, which wiped out the previous five weeks of gains. As was mentioned last week, we are in a “mountain road” market, and have taken an inverse positions in all of the STAY portfolios since 8/11/2023. We will stay in that position until our short-term indicators show otherwise. This position may be for a few days or a few weeks as we will be operating off of our short-term indicators to make changes as needed in a timely fashion. We will keep you posted. Weekly Chart with Fibonacci Retracement Percentages (from the all-time high) 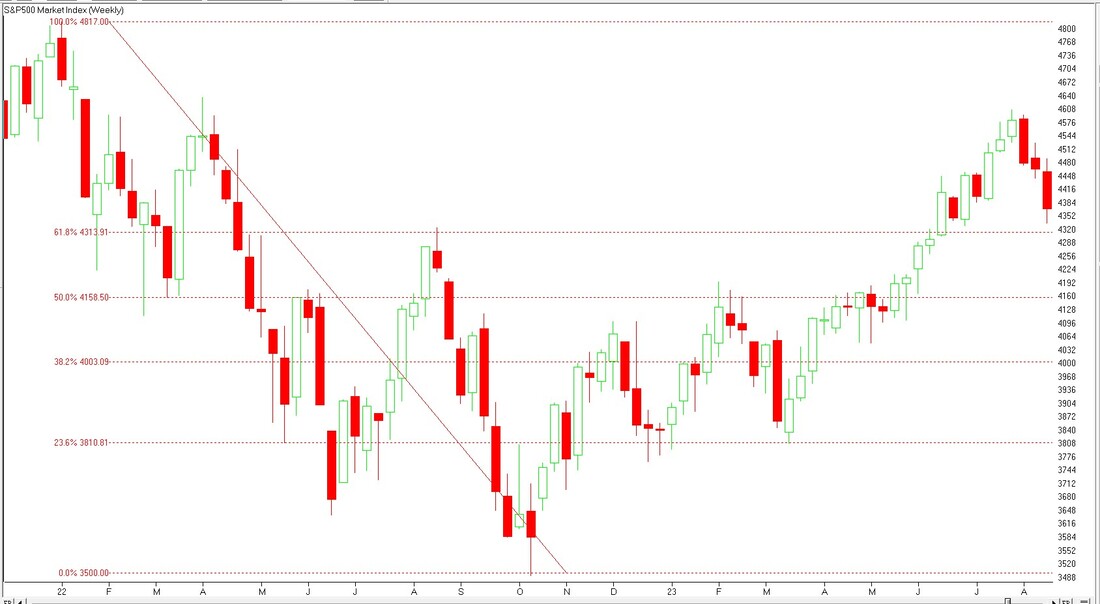 Monthly Chart with Fibonacci Retracement Percentages (from the all-time high) 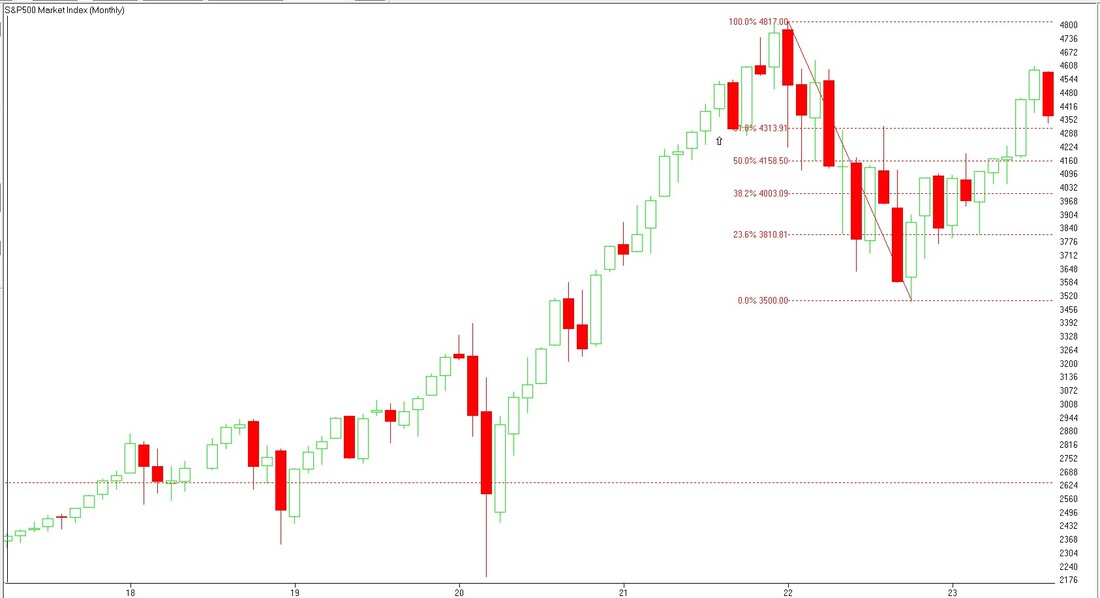
|


208.376.0091Disclaimer: past performance is not a guarantee of future performance. © Copyright - Advanced Financial Solutions, Inc.
|